Thinkific IPO Prospectus Analysis: $276M in Sales, 50k Course Creators, 21M Students
Thinkific allows creators to launch courses under their own brand. Here’s their IPO prospectus in brief.
Last month, Vancouver-based Thinkific went public on the Toronto Stock Exchange (TSX), raising $150+ million. Just like I analyzed Coursera’s IPO filings, I read through Thinkific’s 230-page IPO prospectus.
Since Thinkific (stock symbol: THNC) went public on the TSX, it took me a while to find the prospectus. After a bit of digging, I found it at sedar.com.
Thinkific is part of a group of companies that lets anyone offer online courses and collect payments, and that provides tools to market and acquire students. Their main audiences aren’t traditional educators, but “businesses and entrepreneurs”.
“Thinkific was founded to solve problems for entrepreneurs and businesses seeking to use online education for growth.”
– Thinkific IPO Prospectus
The simplest way to describe Thinkific is as an ecommerce platform for creators to launch online courses under their own brand.
Since the pandemic, we have seen significant investor activity in this space. Last year, Teachable was acquired for $250 million. And just a couple weeks ago, Kajabi raised $550 million at a $2 billion valuation.
In 2020, the total revenue earned by Thinkific course creators, or Gross Merchandise Value (GMV), was $276 million, up from $1 million in 2015. In their latest quarterly report (Q1 2021), GMV reached $107.1 million.
Thinkific customers include course creators ranging from individual entrepreneurs to large enterprises like Shopify, Hootsuite, Petco, and Fiverr. Some of these platforms offer their courses for free.
Thinkific: By The Numbers
At the end of 2020, Thinkific had 50k active creators and 66 million course enrollments from 21 million students.
| 2018 | 2019 | 2020 | |
| GMV | $68M | $112M | $276M |
| Revenues | $6M | $9.8M | $21M |
| Net (loss) | $230k | $291k | ($1.3M) |
| Paying Customers | 7.1k | 10.9k | 24.6k |
| Headcount | 70 | 102 | 223 |
In 2019, Thinkific had a profit of $291k. But in 2020, they raised $22M, doubled headcount, increased spending from $7.4 to $18.1M, and ended up with a net loss of $1.3M.
Thinkific traded profitability for growth. It might seem pandemic related, but the transition had already begun in Q2 of 2019 as shown by the quarterly reports below.
| Revenue | Net (Loss) | |
| Q1 2019 | $2.0M | $366k |
| Q2 2019 | $2.3M | $99k |
| Q3 2019 | $2.55M | $25k |
| Q4 2019 | $2.95M | ($201k) |
| Q1 2020 | $3.3M | ($420k) |
| Q2 2020 | $4.5M | ($386K) |
| Q3 2020 | $6.01M | ($113k) |
| Q4 2020 | $7.2M | ($373k) |
| Q1 2021 | $8.3M | ($1M) |
The strategy seems to have worked. In the most recent quarter, the company’s revenue grew by 152% from $3.3M in Q1 2020 to $8.3M in Q1 2021.
| Q1 2021 | Q1 2020 | |
| Paying Customers | 27.8k | 12.8k |
| Average Revenue per User (“ARPU”) | $106 | $93 |
| Annual Recurring Revenue (“ARR”) | $34.8 million | $14.9 million |
| Gross Merchandise Volume | $107.1 million | $41.8 million |
| Revenue | $8.3 million | $3.3 million |
| Net loss | ($1.0) million | ($0.4) million |
In 2020, Thinkific’s biggest market was the United States: more than half their revenue (around $11 million) came from the US. Canada, where Thinkific is based, accounted for $1.9 million. And the rest of the world accounted for $8.2 million.
Udemy vs Thinkific
Udemy also lets anyone launch online courses. The big difference is that in Thinkific’s case, you can launch these courses under your own brand. Creators also don’t have to share a significant percentage of their revenue like they do with Udemy, and they get access to their own students.
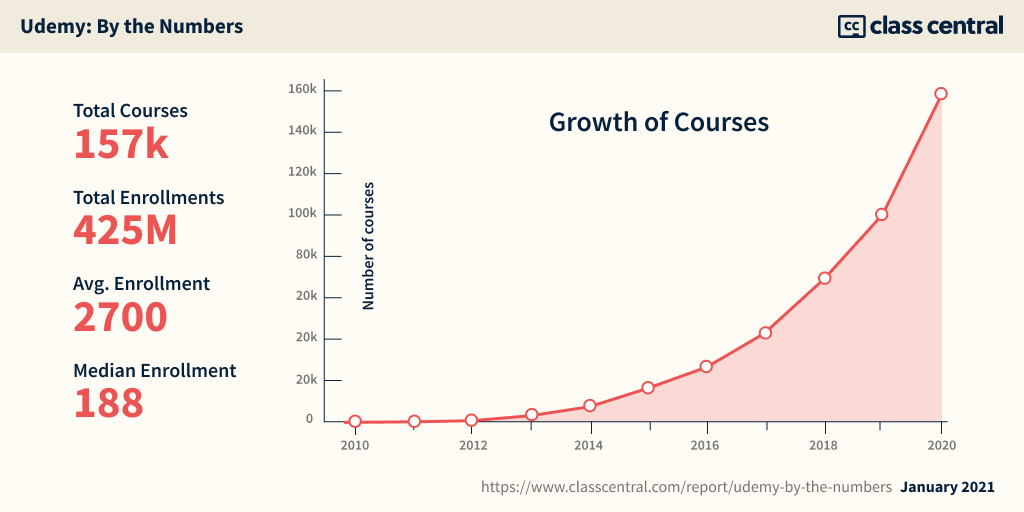
Udemy’s advantage is its immense marketing power, making it one of the most-visited websites on the Web. But when I analyzed Udemy’s catalog, I found that Udemy’s top-20% courses by enrollment account for 90% of all enrollments. The median enrollment for a Udemy course was just 188. And creators are subject to Udemy’s changing policies on revenue sharing.
If you can market your own courses or have a following on major social media platforms, Thinkific and its competitors may be a way to go.
The dynamics at play are very similar to Amazon vs Shopify (which allows you to launch your own ecommerce platform). Udemy is Amazon while Thinkific is Shopify.


Phil
Hi Dhawal,
Where did you find the quarterly Revenue and Net Loss figures? I have combed through the Prospectus and other company filings and can’t seem to find any quarterly data broken down, just annual. If you could please kindly point me in the right direction that would be greatly appreciated.
Thank You,
Phil
Dhawal Shah
Hey Phil,
I found it on Page 93 of the prospectus. Search for “3 Months Ended” in the prospectus.