In-Depth Review: Udacity’s Data Analyst Nanodegree
Udacity’s Data Analyst Nanodegree claims to teach you the skills needed to start a data science career. Is it successful? Find out in this in-depth review.
Udacity’s Data Analyst Nanodegree was one of the first online data science programs in the MOOC era. It aims to “ensure you master the exact skills necessary to build a career in data science.” Does it accomplish its goal? Is it the best option available?
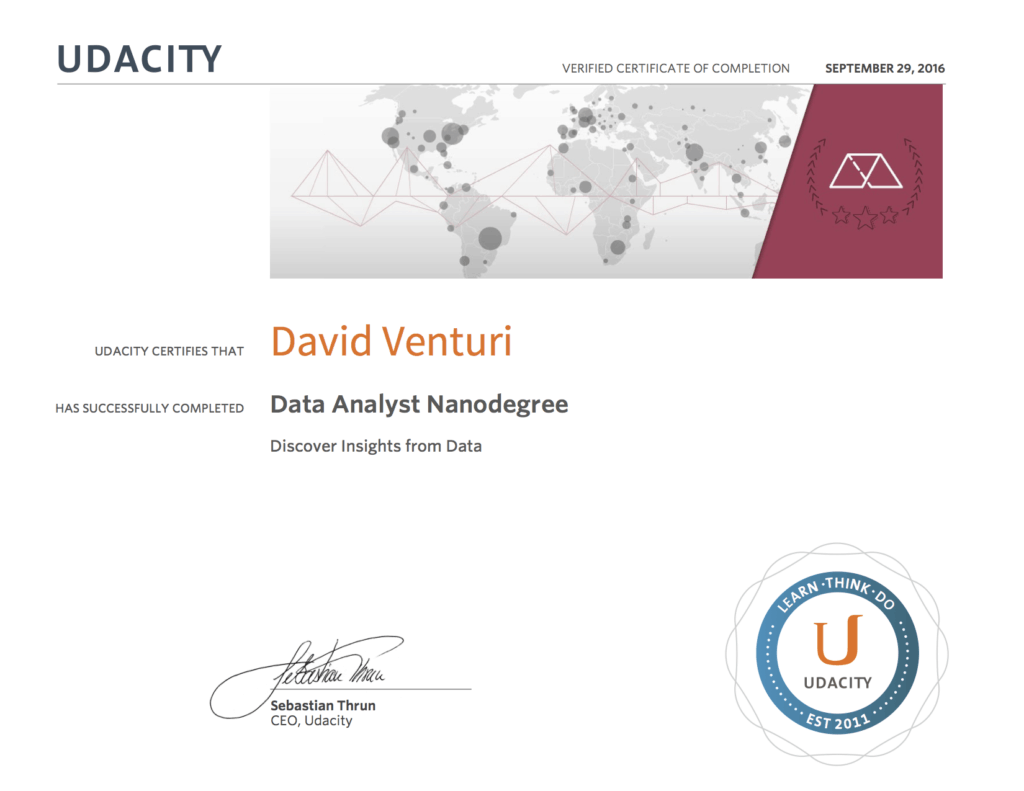
I completed the program a few weeks ago. Using inspiration from Class Central’s open-source review template, here is my review for Udacity’s Data Analyst Nanodegree.
Background information
What made me decide to take this program?
In early 2016, I started creating my own data science master’s program using online resources. (You can read about that here.) I enrolled in the Data Analyst Nanodegree for a few reasons:
- I wanted a guide for my introduction to data science.
- I wanted a cohesive program instead of individual courses from a variety of providers.
- It received stellar reviews.
- I had taken a few Udacity courses before and I was a fan of their teaching style.
What were my goals?
Though the program can act as a bridge to a job (more on that later), I wanted to use the program as an introduction to more advanced material. This “more advanced material” applies to both subjects that are covered in the program and subjects that aren’t.
History of the program
Udacity is one of the leading online course providers. They mostly focus on tech. Sebastian Thrun, ex-Stanford professor and Google X founder, runs the show as founder and CEO.
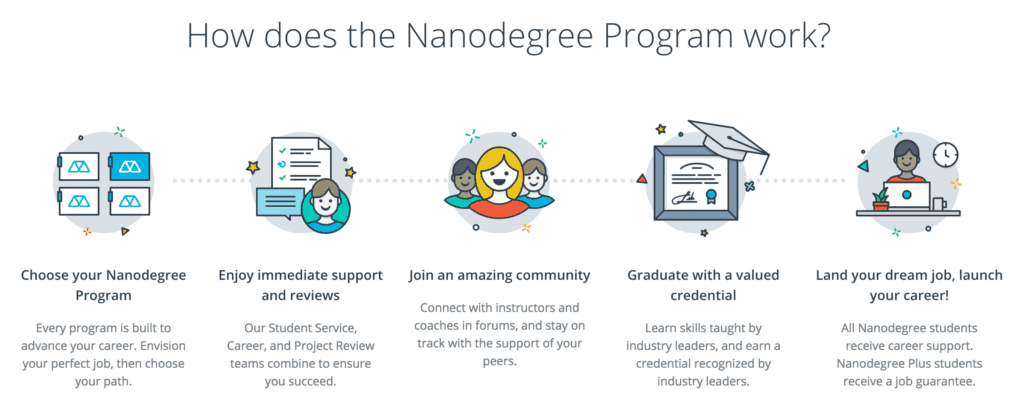
Nanodegrees are online certifications provided by Udacity. They are usually compilations of existing free Udacity courses that have projects attached to them. These projects are reviewed by Udacity’s paid project reviewers. Upon request, students also have access to Udacity Coaches a.k.a. experts in the courses taught at Udacity.
The Data Analyst Nanodegree was originally released in 2014. It was one of Udacity’s first four Nanodegrees. Though it has undergone some changes over the years, the core of the program is intact.
Who are the instructors and what are their backgrounds?
Because the Data Analyst Nanodegree is a compilation of free Udacity courses, there are several instructors. Their resumes often include prestigious roles in major tech companies and degrees from top U.S. schools.
They aren’t “instructors” per se, but Udacity’s project reviewers and forum staff are the people you actually interact with the most. They are so, so helpful. Again, more on that later.
Cost
The Data Analyst Nanodegree costs $200 per month, like most other Nanodegrees. If you graduate within twelve months, Udacity gives you a 50% tuition refund.
Recommended prerequisites
Udacity recommends that students:
- are interested in data science
- have a strong grasp of descriptive and inferential statistics
- have programming experience (preferably in Python)
- have a strong understanding of programming concepts such as variables, functions, loops, and basic data structures like lists and dictionaries
My background / skills entering the program
I started the program in May 2016 when I had a few months of programming experience, mostly in C and Python. The vast majority of this experience was from the bridging module for my data science master’s program, where I took Harvard’s CS50: Introduction to Computer Scienceand Udacity’s Intro to Programming Nanodegree.
I had also finished my undergraduate chemical engineering program and had 24 months of quant-related job experience. This meant I had taken several statistics courses and was comfortable with data.
The Course
Structure
The Data Analyst Nanodegree is split up into eight sections: “P0” through “P7” (I am unsure if the “P” stands for Part, Project, or something else … Penguin?). P0 is optional and is basically an easy version of P1 to get you used to the Udacity learning environment.
Each section’s video content are either full Udacity courses or selections of videos from Udacity courses. Videos tend to range from 30 seconds to five minutes, as per Udacity’s style. Automatically graded quizzes often follow these short videos. These quizzes are usually multiple choice, fill-in-the-blank, or small programming tasks.
Sometimes problem sets follow big chunks of video content. These can take a few hours sometimes, though most are quicker.
Again, each section has a graded project. These projects and the feedback from Udacity’s paid project reviewers are where a lot of the value lies for most Nanodegrees.
Syllabus
My edition of the Data Analyst Nanodegree had the following syllabus:
P1: Statistics
- Highlighted content: Standard deviations, confidence intervals, z-scores, and t-tests
- Project: Test a Perceptual Phenomenon. Design and implement your own hypothesis test for a version of the Stroop test.
P2: Intro to Data Analysis
- Highlighted content: NumPy arrays, pandas DataFrames, and vectorized operations
- Project: Investigating a Dataset. Pose your own question about a dataset, investigate its contents and communicate your findings.
P3: Data Extraction and Wrangling
- Highlighted content: SQL, MongoDB, and assess data quality
- Project: OpenStreetMap Improvements. Clean some OpenStreetMap data for a part of the world that you care about.
P4: Exploratory Data Analysis
- Highlighted content: R, investigate datasets, reshape data frames
- Project: Explore and Summarize Data. Demonstrate your mastery of EDA by exploring the variables, patterns, and oddities within a dataset.
P5: Machine Learning
- Highlighted content: Naive Bayes, Support Vector Machines, F1 scores
- Project: Identify Fraud from Enron Email. Build an algorithm to identify Enron employees who may have committed fraud.
P6: Data Visualization
- Highlighted content: HTML, CSS, D3.js, dimple.js
- Project: Storytelling with Data. Choose a dataset and use popular visualization libraries to create your own interactive visualizations.
P7: Design an A/B Test
- Highlighted content: Defining experimental groups and validating metrics
- Project: Create an A/B Test. Analyze the results of an A/B test and recommend whether or not to launch the change.
Grading
Projects are graded on a pass/fail basis according to a rubric. Each project’s rubric is unique. Your project must satisfy all sections of the rubric.
The automatically graded quizzes do not count towards your grade, though Nanodegrees don’t really have grades, anyway. You either pass all of the projects or you don’t. If an individual project submission doesn’t pass, your project reviewer gives you feedback, then you can adjust your work and try again.
My experience
Timeline
Udacity’s estimated timeline for the Data Analyst Nanodegree was 378 hours when I started. They have changed up their timelines since then. They now say: “On average, our graduates complete this Nanodegree program in 6–7 months, studying 5–10 hours per week.”
According to Toggl (a time tracking app), the whole program took me 369 hours over five months. This timeline included dedicating serious time to making my projects portfolio quality, as opposed to producing the minimum to satisfy the pass/fail rubric.
How was the course content?
The course content from P1, P2, P4, P5, and P7 get five stars out of five from me. P3 and P6 get four stars.
The exploratory data analysis content with Facebook employees (P4) was so illuminating. The intro machine learning course with Sebastian Thrun and Katie Malone (P5) was the most fun I’ve had in any online course. The A/B testing content with Google employees (P7) is so unique. I’d give those three courses six stars if I could.
The SQL and MongoDB content (P3) weren’t amazing. Same with the data visualization content (P6), though that probably was because D3.js is super difficult to teach to JavaScript newbies. These opinions aren’t uncommon, according to the Class Central’s reviews for those courses. Check them out here and here.
Some of the videos had mistakes in them, which were corrected in the notes section below the video. This issue is par for the course for most online courses, though. That doesn’t make it less annoying when you forget to check the video notes and spend a bunch of time trying to figure out what you’re missing, though.
How were the projects?
Again, projects are where Udacity sets themselves apart from the rest of the online education platforms. They invest in their project review process and it pays off. The Data Analyst Nanodegree was no exception.
All of the projects reinforce the content you learned in the videos. Their project reviewers know their stuff. They tell you where you succeeded and where your mistakes and/or omissions are. Supervised learning by doing. It works. (No, not that supervised learning.)
The forums and the forum mentors are especially helpful when you get stuck. Search the forums to see if your problem is a common one (they usually are). No luck? Post a new question yourself. There is one forum mentor, Myles Callan, who seems to know everything about everything and responds within hours. I have my doubts that he sleeps.
If you’re curious to see what these projects look like, check out my Data Analyst Nanodegree Github repository.
How hard was it?
The statistics content was easy for me because I had taken several stats courses in undergrad. This would probably be true for every topic in the Nanodegree if you had prior experience in it.
I’d categorize most of the Nanodegree as intermediate difficulty. Lecture content that doesn’t have a problem set attached can be a breeze. The projects exercise your brain. Each will probably take you more than twenty hours if you want to be thorough.
The P4 project was the most challenging to pass. It took me 3.5 submissions. Check out this Twitter thread for more details.
Can you apply for jobs immediately post-graduation?
You can. The program should equip you with the required skills for an entry-level data analyst role if you take it seriously. Eli Kastelein is a perfect example of that. You can read more about his story here.
You can also continue onto more advanced courses, both for the subjects covered in the program and for other subjects. This is what I chose to do.
Final thoughts
Would I take the program again knowing what I know now?
Somewhere towards the end of the program, I started creating Class Central’s Data Science Career Guide. This entailed researching every single online course offered for every subject within data science.
Though I enjoyed the majority of courses within the Nanodegree, there are other courses from other providers that receive even better reviews for certain subjects. Statistics, for example. If I had access to my guide back when I started, I would strongly consider the separate-course-for-each-subject route since the most of the individual courses within the Data Analyst Nanodegree aren’t the best-rated courses for their subject area.
Udacity’s specialized forums and project review process, however, are so effective for learning that I would probably take it regardless. It’d be an effort logistically, but the ultra-optimized approach might be to take the best individual courses for each subject then enroll in the Nanodegree to complete their projects and receive their mentorship.
The alternatives
There are four alternatives that I have come across so far:
- I do not recommend the Johns Hopkins University Data Science Specialization because the individual courses within it get such poor reviews (examples: Regression Models, The Data Scientist’s Toolbox, R Programming, Statistical Inference).
- I can’t make a recommendation on Microsoft’s Professional Program Certificate in Data Science yet. It is very new — released in July 2016. Some of the courses get bad reviews and some don’t even have reviews yet.
- Wesleyan University’s Data Analysis and Interpretation Specialization on Coursera has a nice, concise curriculum, though I can’t make a recommendation yet here either. Few reviews for the individual courses and they are in the 2–3 star range.
- Datacamp’s Python and R tracks are enticing. They already have one of the most comprehensive curriculums and continue to build out their product.
- Dataquest is another option similar to Datacamp. Some say Datacamp is better for R while Dataquest is better for Python.
Conclusion
Udacity’s Data Analyst Nanodegree gives you the foundational skills you need for a career in data science. Post-graduation, you’ll be able to target your strengths and weaknesses, and supplement your learning where necessary. Plus, you’ll leave with a handful of portfolio-ready projects.
I loved it, as did others.
★★★★¾
Author Bio
David Venturi created a personalized data science master’s curriculum for himself using MOOCs. He has a dual degree in Chemical Engineering and Economics, and especially enjoys math, stats, and coding. He’s a huge baseball and hockey fan, and writes about the latter with a focus on analytics.


