In-Depth Review: Statistics for Business -1 from IIMB on edX
Detailed review by Class Central user Rodrigo Serrano on this practical introduction to statistics and probability using spreadsheets.
Review by Rodrigo Serrano. He is a passionate digital learning professional based in Paris, France.
Took the course? Write your own review here. Read all reviews.
The first of a four-part series, Statistics for Business 1 is a superbly designed, spreadsheet-based course on introductory statistics and probability. The truly practical approach of the course should attract just about anyone wishing to gain spreadsheet and statistically savvy for solving real business problems.
The course was archived by the time this text was written, but you can still access the content and go through the quizzes. The faculty at IIMBx are considering re-running it, which would allow you to get a verified certificate.
Statistics for Business – I | IIMBx on edX | Course About Video
A SPREADSHEET APPROACH TO LEARNING STATISTICS
I studied statistics and probability as an economics major. I remember being seriously turned off by the quickly escalating levels of abstraction during the lectures. I believe I am not the only one having endured the “chalk-and-talk” approach to learning these subjects.
A couple years later, I found myself working for a major online training provider. We had to go through datasets and figure out what the content consumption patterns of our customers looked like. After being at task for a couple days, I realized there were holes in my spreadsheet and statistical game. I was able to carry out a proper analysis with the help of my colleagues, but I became self-conscious about my skills.
A month later I ran into the Statistics for Business 1 course on the edX platform, which promised to “examine data from the perspective of business scenarios”. I didn’t hesitate to enroll.
I didn’t know it that day, but I was in for a great ride.
A DEMANDING, SELF CONTAINED COURSE
Statistics for Business 1 is definitely demanding, yet no prior knowledge of statistics or spreadsheet manipulation is required. Week Zero provides sufficient practice and resources on the necessary spreadsheet skills (vlookup, pivot tables…). It is all uphill from there, but the faculty at IIMBx seem to have found the sweet spot between accessibility and challenge.
THE INSTRUCTOR

Professor Venkatagiri displays a total command of the subject and a very welcome sense of humor.
The course was designed by faculty at the Bangalore branch of the Indian Institute of Management, an academic powerhouse located in the “Indian Silicon Valley”. The main instructor is Professor Shankar Venkatagiri, a mathematician and computer scientist with broad business experience, a phD from the Georgia Institute of Technology, total command of his subject and a very welcome sense of humor.
Dr. Venkatagiri guided us expertly through the tutorials. His crystal clear walkthroughs are coupled with helpful insights on how to correctly interpret our findings. Lisa, his brainy yet modesty-challenged assistant, added just the right amount of quirkiness to the course.
REQUIREMENTS
You will need a spreadsheet software such as Excel, Numbers or Calc. A good internet connection is necessary, since most of the information in presented in the form of video tutorials.
Due to its hands-on nature, it is not possible to take this course solely on a mobile phone. I personally recommend using two screens so as to follow the tutorials and carry out the exercises comfortably.
DIFFICULTY & TIME COMMITMENT
You will need a solid 5-7 hours per week for about 5 weeks to go through the course. You will get to practice all the material presented during the extensive, all-hands-on exercises that count for the final grade. By the end of the course, I had accumulated a good 40 hours of practice.
Some of the exercises were challenging and I often had to re-watch big chunks of the lectures to be able to answer to a single quiz question. This is especially true for the final exam, which is no walk in the park.
WEEKS 1 & 2
After going through Week Zero and brushing up on the required functions and tools, we plunged into the world of descriptive statistics. We worked on an authentic dataset about worldwide tourism trends from the World Tourism Organization.
After cleaning up and organizing the data, we used graph tools to visually analyze the underlying trends. We then manipulated the ridiculously useful pivot table tool and determined summary measures for centrality and dispersion such as mean, median and standard deviation.
In Week Two we took it up a notch and learned about numerical and categorical variables; we practiced reading and building histograms and scatterplots and calculating correlation coefficients.
One of the most interesting sections of the course are the “caselets”, real-life business scenarios that allowed us to put our knowledge to practice.
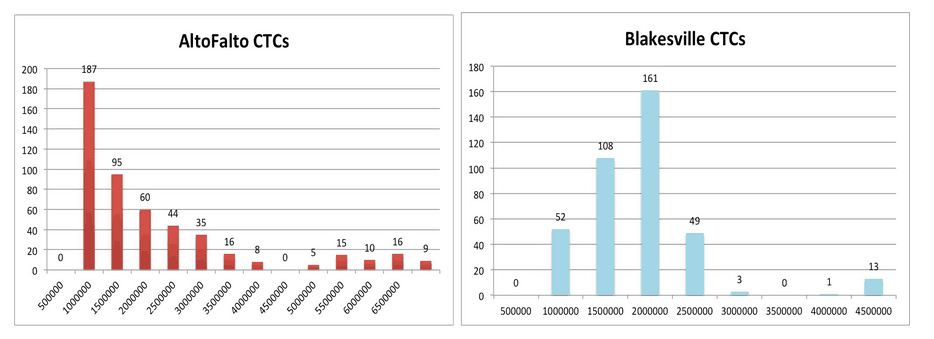
For the first caselet we first put ourselves in the shoes of a prospective Business School student trying to make a data-driven decision on which MBA to enroll. We used a dataset of graduates’ salaries from two Business Schools to figure it out.

In the second caselet we plunged into two authentic datasets obtained through government surveys. We measured differences in quality of life between a newly separated Indian region and the province it separated from. We used this information to evaluate the differences in human development between regions, which had been the separatists’ major argument.
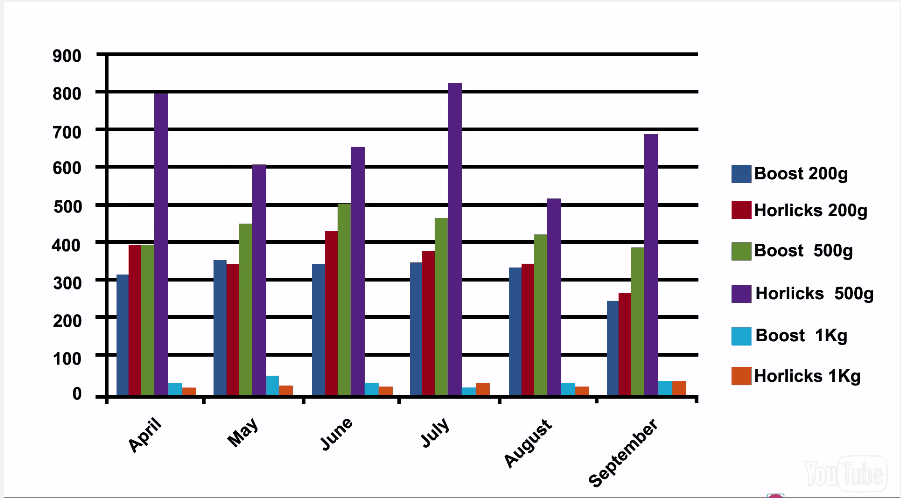
We finally followed a demo (one of the few “non-tutorial” videos) and analyzed information from a small retail business. Using bar charts, we visualized and compared sales volumes so as to wisely manage product stock.

In the first demo, we visualized and compared sales volumes to help a retailer make a sound decision on how to manage his stock.
WEEKS 3 & 4

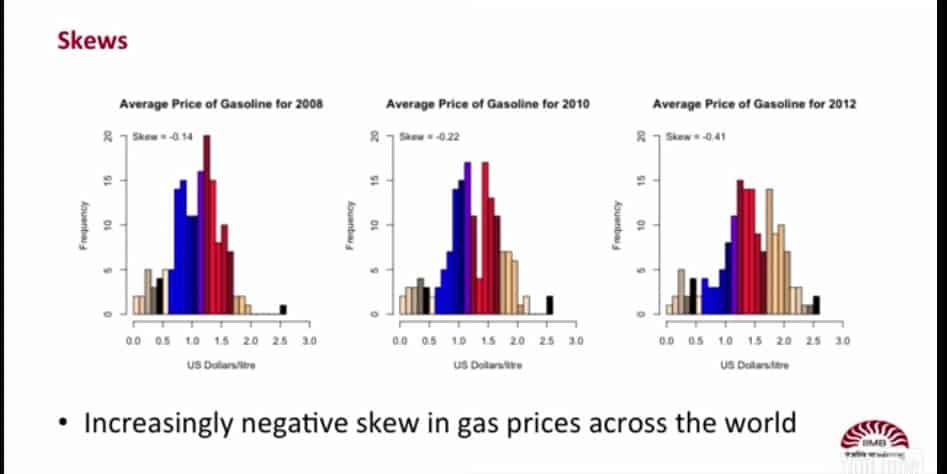
In week three we studied worldwide oil prices using asymmetry and peakedness measures such as skewness and kurtosis
During the extensive third week we learned about summarizing grouped data. We studied worldwide oil prices using asymmetry and peakedness measures such as skew and kurtosis; we also obtained percentiles and built box plots.
For the business caselets, we put ourselves in the shoes of Ramya, a business executive working for Souravi Fashions, a clothing manufacturer and retailer. We used a dataset containing point-of-sales information as well as household income in the localities around the stores. We put our new skills to good use and helped her choose the best localities for opening new stores. In a separate exercise, we also analyzed a dataset on stock prices of Indian technology firms.
We wrapped up this very long week with a demo, in which we extensively used filters to organize demographic information and reveal trends in the evolution of age pyramids across countries.
PROBABILITY PROBLEMS DEALING WITH BALLS IN AN URN? NOT IN THIS COURSE

No urns were hurt while producing the module on probabilities.
Week four is focused on probabilities. It is as time consuming as the previous one and arguably even more challenging. We learned how to use the almighty pivot table to derive joint, marginal, and conditional probabilities and to apply the Bayes rule. As professor Venkatagiri pointed out, there is no such thing as dice, cards or balls in urns in this course, only realistic business scenarios.
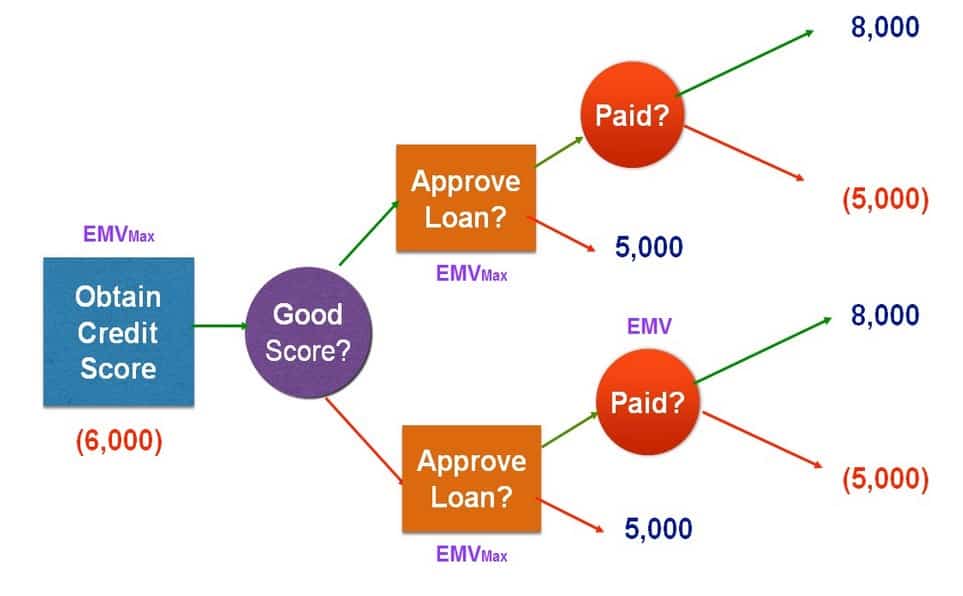
There is also a long, two -part “Capstone Demo” where we learned about decision trees, a useful tool for visualizing complex business problems. We used this new tool to determine the best lending practices within a large financial institution.

In week 4 we used decision trees to determine best lending practices within a financial institution.
FINAL EXAM & GRADING
The Final Exam is a true feat of strength that covers most of the topics in the syllabus. It took me a full day to complete and I would recommend future students to block a full weekend to take it in the best conditions, since it is worth 30% of the final grade
The rest of the grade is obtained from the quiz-type questions, caselets and long practical exercises spread all through the course. The design of the quizzes is truly top-notch, and will help you get solid practice.
CLASSROOM COLLABORATION
Even though the teaching assistants were prompt to clarify whatever issue came up, I did not find the forums particularly active or useful. There are no peer-reviewed assessments yet I believe the faculty largely made up for this with their top notch quiz design. A statistics songwriting contest (yep!) spiced things up a bit.
IN A NUTSHELL
Statistics for Business 1 is a hands-on, spreadsheet-based tour de force of a Mooc. It can help you seriously increase your spreadsheet, statistics and probability savvy and apply it to real business problems. I won’t hesitate to enroll in the next installment, Statistics for Business 2, available September 29th, 2015 on the edX platform.
Class Central is looking for reviewers and regular contributors. If you’ve ever finished a MOOC and want to write a critique to help future students considering taking that course, we want to hear from you. Drop us a mail.


IIMBx MOOCs
Rodrigo – On behalf of the IIMBx course team for QM101.1x, thank you for your detailed and wonderful review of our course. Statistics for Business-1 was our first ever MOOC and we are happy to note that you attained your learning objectives from it! Do take a look at Statistics for Business-2 which is live now for an equally stimulating learning experience with R.
– IIMBx MOOC Team
Link to QM101.2x MOOC on edx: https://www.edx.org/course/statistics-business-ii-iimbx-qm101-2x