10 Best Tableau Courses for 2025
Make successful data-driven business decisions with the world’s leading analytics platform.

In today’s data-driven world, “data” is ubiquitous. If you are an analyst, data scientist, student, teacher, or an executive, you’re bound to encounter data in some way or another. Understanding it can help you make better decisions and solve problems. Enter Tableau – the market-leading visual analytics platform. Tableau simplifies the process of exploring and managing data, enabling users to discover and share insights.
This Best Courses Guide (BCG) has a selection of the best Tableau online courses from over 400 Tableau courses in our catalog, including popular courses from Udemy, Datacamp, LinkedIn Learning, and YouTube. These courses will guide you through Tableau main features, provide real-world exercises, and also help you prepare for Tableau Data Analyst or Desktop Specialist certifications.
Click on the shortcuts for more details:
Our Top Picks
BCG Stats
- All courses have accrued over 725K enrollments and 286K YouTube views
- 2 courses are free or free-to-audit and 7 courses are paid
- The most-represented course provider in the ranking is Udemy, with 5 courses
- The Tableau subject is followed by over 4.2K learners on Class Central.
Best Overall: Tableau Business Intelligence Analyst (Tableau Learning)
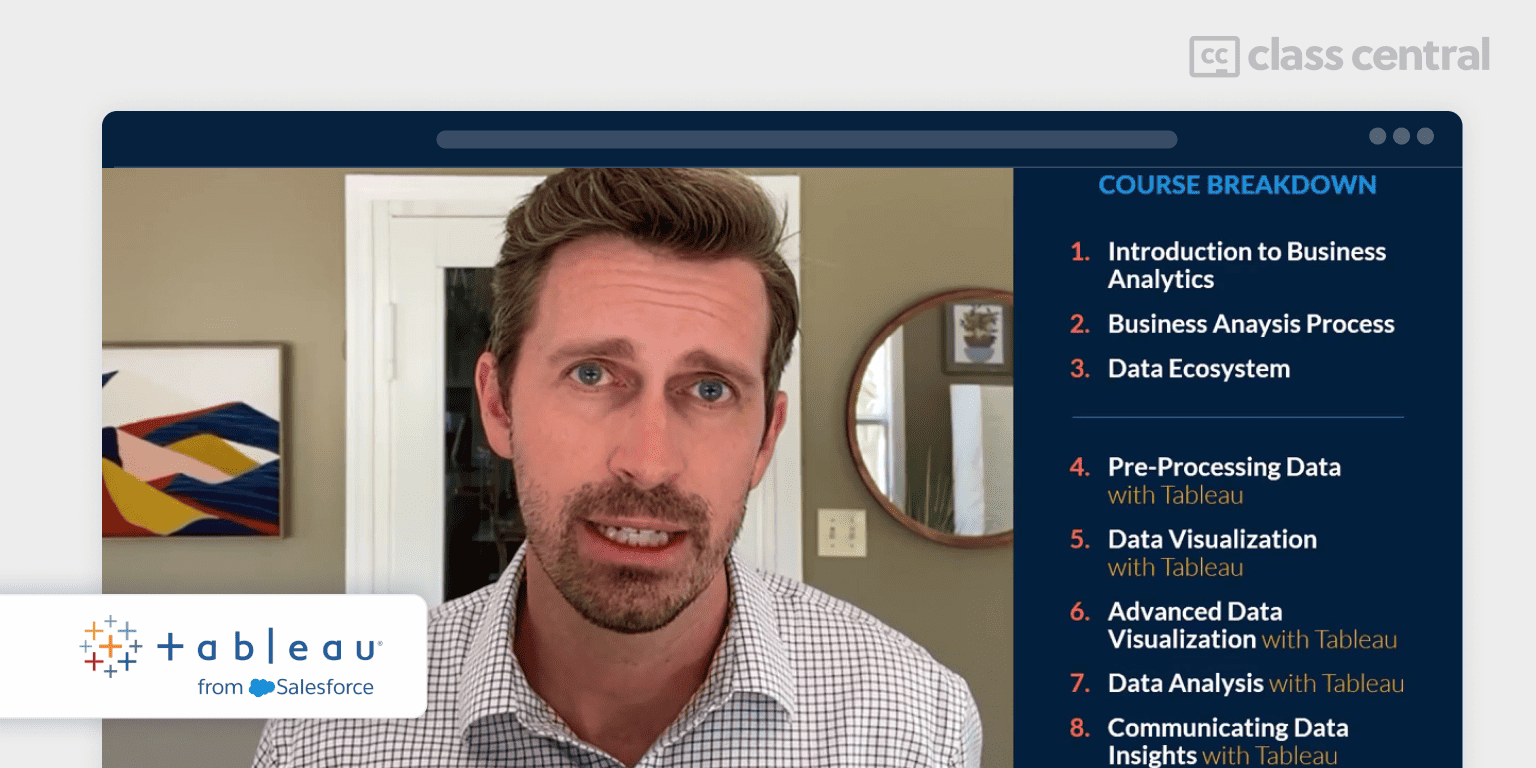
Tableau Business Intelligence Analytics Professional Certificate is designed to prepare you for entry-level jobs in business intelligence analysis. This program is ideal for individuals who are detail-oriented and interested in identifying data trends. Through practical, real-world exercises, you will acquire the skills necessary to use the Tableau platform for data evaluation and presentation of actionable business insights. Upon completion, you will also be ready to take the Tableau Desktop Specialist Exam.
To access the free-to-audit option, visit each course page linked below. For more information, see A Guide on How to Sign up for Coursera Courses for Free.
The courses included are:
- Introduction to Business Analytics: the foundational skills in Tableau and business analytics
- Business Analysis Process: a basic understanding of the process of business analysis
- Data Ecosystem: understand the entire data ecosystem, including data management
- Introduction to Tableau: learn the value of data visualizations
- Data Visualization with Tableau: present data through clear and easily comprehensible visuals
- Advanced Data Visualization with Tableau: create advanced data visualizations
- Data Analysis with Tableau: manipulate and prepare data for analysis and reporting
- Communicating Data Insights with Tableau: the best practices using Tableau.
| Provider | Coursera |
| Instructor | Tableau Instructor |
| Level | Beginner |
| Workload | 8 months, 10 hours a week |
| Enrollments | 32.4K |
| Rating | 4.7/5.0 (588) |
| Certificate | Paid |
Best Tableau Bootcamp with Live Sessions and Mentoring (Noble Desktop)
If you prefer instructor-led learning, Noble Desktop’s Tableau Bootcamp offers real-time feedback and accountability that pre-recorded courses can’t match.
What I find interesting is that this program runs both in-person (NYC campus) and online (Zoom). Even if you’re attending online, you’ll have individual attention and can see other students in the classroom. You’ll be able to interact with instructors, receive feedback, and ask questions during sessions. Plus, you’ll get access to class recordings and workbooks – pretty helpful for catching up if you miss a class or reviewing what you learned.
Key Benefits
- Small class sizes (8-15 students)
- Includes six 1-on-1 mentoring sessions
- Free retake within one year
- Job support: resume writing, tips for finding jobs, and interview prep
Noble Desktop knows what they’re doing – they’ve been around for over three decades providing instruction with industry experts. So you can rest assured your mentorship will not be with someone who just finished the course. Don’t take my word for it – student reviews on Yelp and Google praise their practical approach and instructor quality.
What You’ll Learn
- Basics of data visualization and how to clean data for analysis in Tableau
- Tableau’s data manipulation tools include filtering, sorting, pivoting, and using the Data Interpreter
- Create visualizations such as bar charts, treemaps, line charts, and dual-axis maps
- Geographic visualizations, including choropleth maps and proportional symbol maps
- Advanced visualizations like heat maps, spider charts, alluvial diagrams, and dual-axis layered maps
- Customize visualizations with calculated fields, formatted axes, and Tableau’s Marks panel
- Design dashboards and add interactivity for different display types
- Share your work by publishing visualizations to Tableau Online or embedding them into websites
Flexible Schedule Options
- 2 days full-time (weekdays)
- 2 weeks part-time (evenings)
“For a beginner who is not in the corporate world, this bootcamp definitely felt inclusive; the instructor was also enthusiastic about answering an array of questions.” – Meha Gupta
| Institution | Noble Desktop |
| Provider | Direct (NYC campus or Live Online) |
| Instructors | Dan Rodney, Jerron Smith, Garfield Stinvil |
| Level | Beginner to Intermediate |
| Workload | 12 hours |
| Rating | 4.8/5.0 (Yelp) and 5.0/5.0 (Google) |
| Certificate | Certificate of Completion |
Best Tableau Course for Beginners in Data Science (Udemy)

Learn to analyze and visualize data in Tableau through real-life datasets in Tableau 2024 A-Z: Hands-On Tableau Training for Data Science. Each module of this course is independent, so you can work on whichever section you like, and complete the course by doing things yourself. By the end of this course, you’ll be a proficient Tableau user who can analyze and visualize any kind of data from scientific to financial and more. Eremenko is a data scientist with experience in finance, retail and transport, and a background in physics and mathematics.
In this course, you will learn:
– Installation and data connection in Tableau Desktop 2022
– Creating various types of charts and visualizations
– Understanding joins and data blending
– Advanced features like table calculations, parameters, and dual axis charts
– Exporting results and working with time series data
– Aggregation, filters, hierarchies, and advanced data preparation.
| Provider | Udemy |
| Instructor | Kirill Eremenko |
| Level | Beginner |
| Workload | 8-9 hours |
| Enrollments | 395K |
| Rating | 4.6/5.0 (101K) |
| Certificate | Paid |
Best Tableau Certification Prep Course (Udemy)
Tableau Data Analyst/Specialist Desktop Certification is for anyone who wants to add Tableau to their toolkit and prepare for official Tableau Data Analyst or Desktop Specialist certifications. Led by Phillip Burton, an experienced Computing Consultant, this course provides expert guidance from the basics of Tableau to gradually more advanced techniques.
In this course, you will:
- Download and install the full version of Tableau Public (for free)
- Create analyses such as line charts, stacked bar charts, and geographic analyses using maps
- Show an overview using dashboards and tell a story using storyboards
- Enhance visualizations by formatting numbers and dates, adding labels, tooltips, and animation effects
- Learn advanced features: calculated fields, parameters and hierarchies
- Obtain the knowledge required to qualify for official Tableau certification exams.
| Provider | Udemy |
| Instructor | Phillip Burton |
| Level | Beginner |
| Workload | 15 hours |
| Enrollments | 67K |
| Rating | 4.6/5.0 (14K) |
| Certificate | Udemy |
Best Tableau Tutorials on YouTube for Beginners (Alex the Analyst)
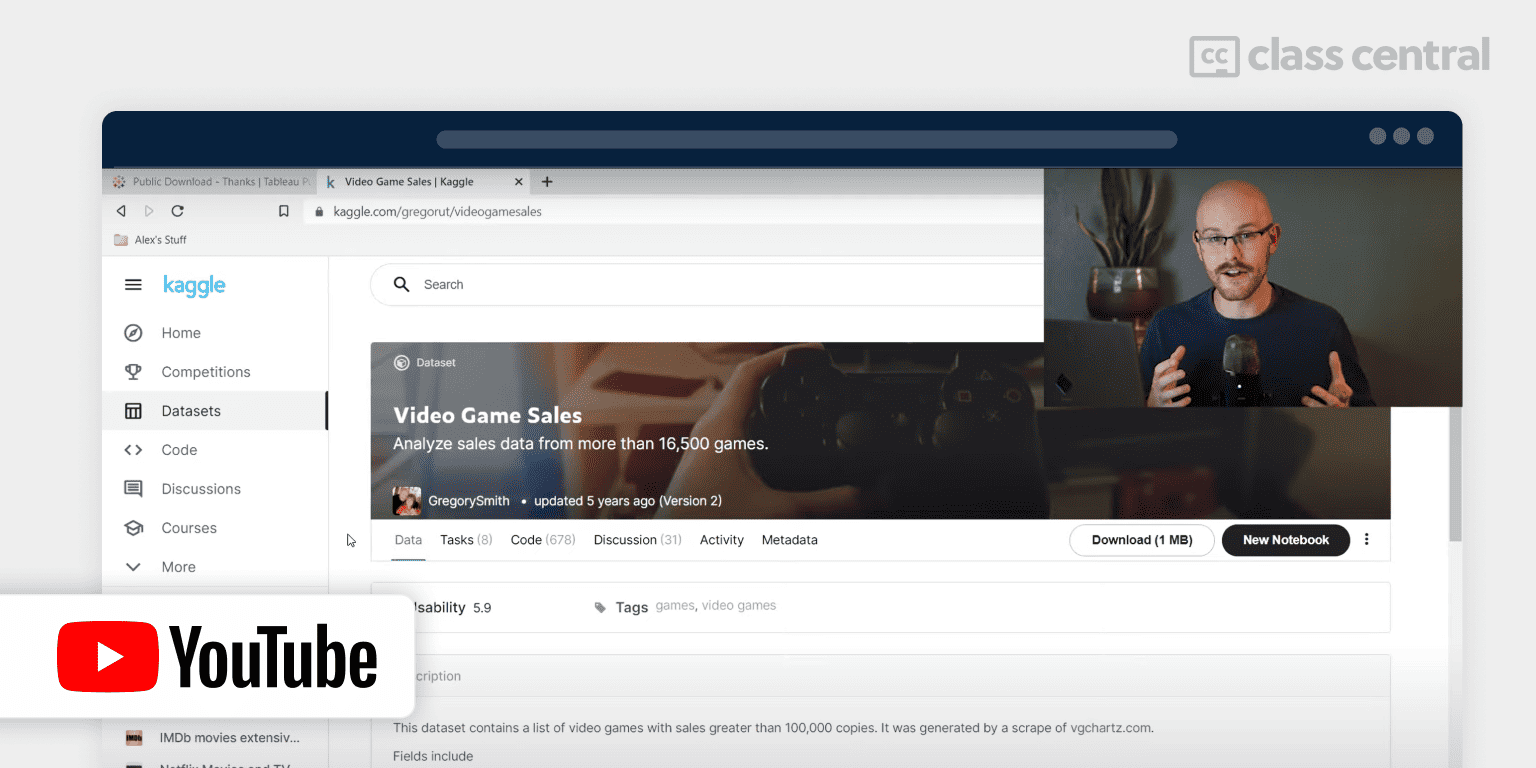
Tableau Tutorials for Beginners is completely free, and short enough to be completed within a couple of hours. As a beginner about to step into the world of data analytics and visualization, this course will introduce you to the very basics of Tableau to get you started with the help of downloadable resources. You’ll also get to work on a project to apply your Tableau skills.
In this course, you’ll learn about:
- Installing Tableau and building your first visualization
- Calculated fields, bins, density maps
- Bar and line graphs, and more visualizations
- Joins
- Work on a full project in Tableau.
| Channel | Alex the Analyst |
| Provider | YouTube |
| Instructor | Alex Freberg |
| Level | Beginner |
| Views | 286K |
| Workload | 1-2 hours |
| Certificate | Not available |
Also Great Tableau Training for Absolute Beginners (Udemy)
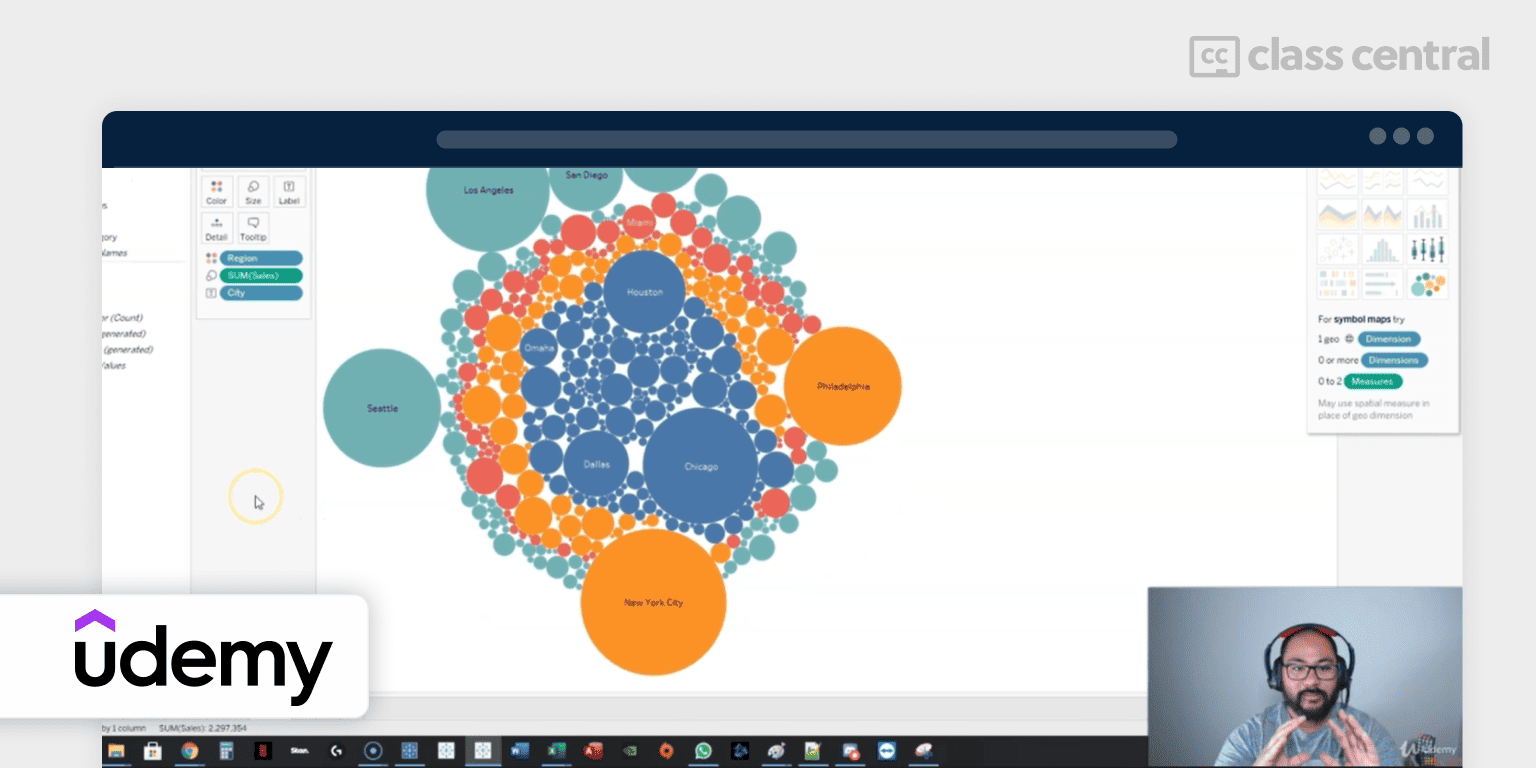
Learn the complete Tableau platform – Desktop, Online, Prep, Bridge and Conductor with this comprehensive course. 2024 Tableau Certified Data Analyst Training is designed for absolute beginners who want to be more efficient in their data analytics skills. You’ll also be prepared for official Tableau exams like Tableau Desktop Certification, Tableau Certified Associate, and Tableau Certified Data Analyst.
This course covers:
- A 1 hour accelerator program on Tableau Desktop, teaching how to connect to Excel data, create charts, perform calculations, and build dashboards
- A beginner- and intermediate-level overview covering the topics: creating simple charts, filtering data, and performing calculations
- An expert-level overview focusing on advanced topics: data unions, joins, and using parameters
- Tableau Online: designing an online site, publishing dashboards to the cloud, and managing collaboration filters and users
- Data cleaning techniques: grouping and replacing similar terms, converting text to uppercase/lowercase, and removing extra white spaces.
| Provider | Udemy |
| Instructor | Jed Guinto |
| Level | Beginner |
| Workload | 53 hours |
| Enrollments | 80K |
| Rating | 4.7/5.0 (12K) |
| Certificate | Paid |
Best Tableau Course for Intermediate Data Scientists (LinkedIn Learning)
Tableau for Data Scientists is designed for learners with some basic understanding of Tableau. Aimed towards intermediate data analysts, this course builds on your existing Tableau skills, and moves up to more advanced features that will help you level up your Tableau game.
In this course, you will learn:
- The green and blue fields and their impact on rows and columns
- How to connect to different types of data sources: Excel sheets and PDF files
- Combining data through relationships and joining tables
- How to create and work with data extracts
- Comparing measures using different chart types
- Calculations in Tableau including table calculations and level of detail (LOD) calculations
- The process of mapping your data
- Advanced analytics features: reference lines, bands, and motion charts
- Utilizing parameters for enhanced interactivity in your visualizations
- Dashboard design tips including containers, filters actions, and URL actions.
| Provider | LinkedIn Learning |
| Instructor | Matt Francis |
| Level | Intermediate |
| Workload | 6 hours |
| Enrollments | 88K |
| Rating | 4.8/5.0 (1.6K) |
| Certificate | Paid |
Best Advanced Tableau Course for BI & Data Analysis (Udemy)
Whether you’re an aspiring analyst, or just looking to take your Tableau skills to the next level, Advanced Tableau for Business Intelligence & Data Analysis is for advanced data analysts who have built expert-level data analyses and visualizations before. It is hands-on and project-based, letting you apply your knowledge to real-world scenarios.
Led by Dustin Cabral, a professional data visualization consultant and Tableau developer with over 10 years of experience leading analytics and BI projects.
In this course, you’ll cover the following topics and more:
- Tableau relationships – Logical and physical layers, contextual joins, smart aggregation
- Dynamic design – Custom templates, KPI shapes, dynamic formatting, filter menus
- Parameter and set actions – Interactivity, relative dimensional analysis, animation, color scaling
- Geospatial mapping – Spatial functions, custom territories, hierarchies, background maps
- Advanced calculations – RegEx, advanced table calcs, LOD functions, cohort analysis
- Predictive analytics – Regression models, forecasting, clustering, R and Python integration.
| Provider | Udemy |
| Instructor | Dustin Cabral |
| Level | Advanced |
| Workload | 11 hours |
| Enrollments | 10K |
| Rating | 4.4/5.0 (1.1K) |
| Certificate | Paid |
Best Tableau Course in Creating Dashboards (DataCamp)
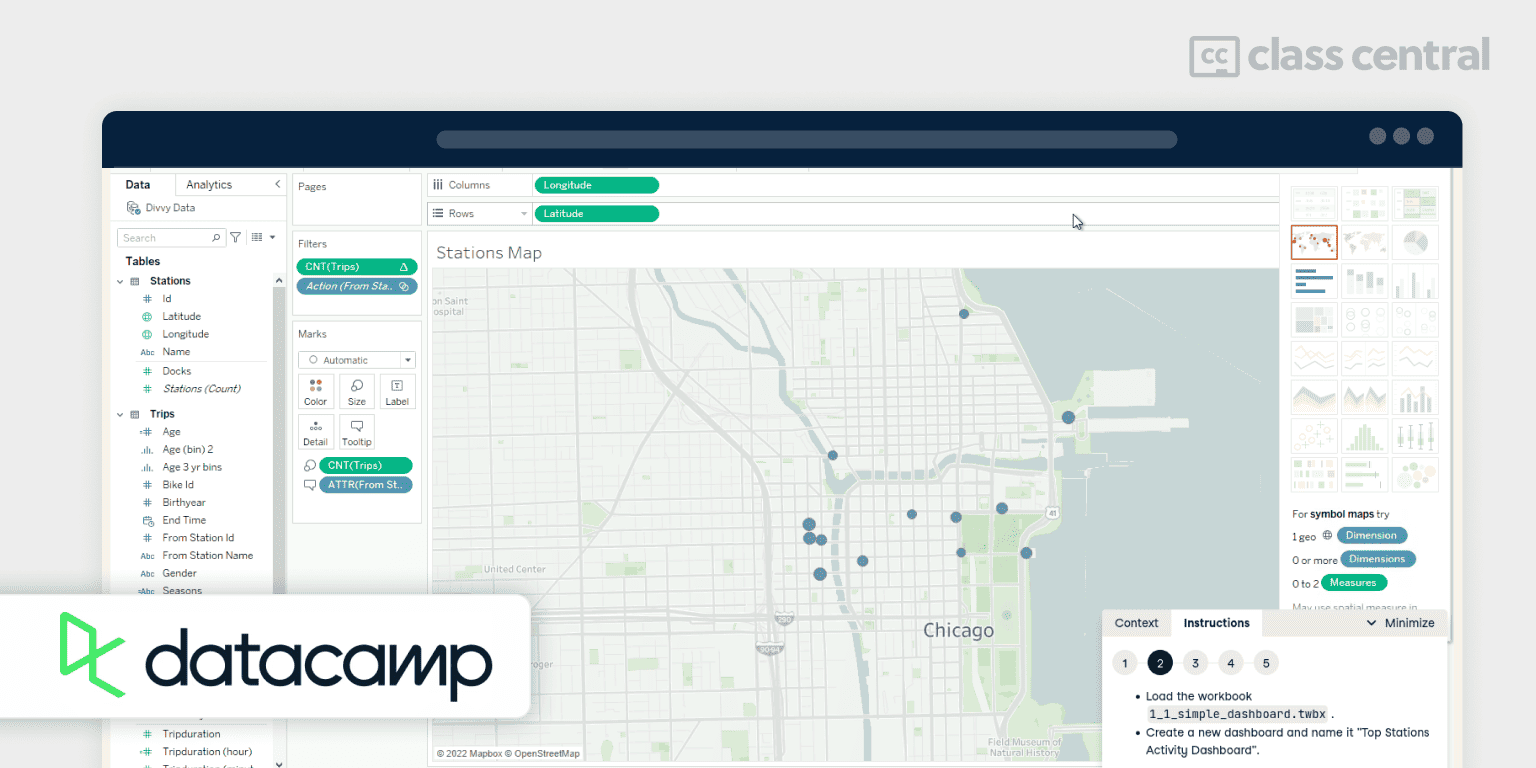
Creating Dashboards in Tableau teaches you all about one of the important features of Tableau – dashboards. Dashboards are a common way to display the results of your analysis together in a simple and visually appealing way. According to tableau.com, “A dashboard is a way of displaying various types of visual data in one place”.
In this course, you will:
- Get started with dashboards: best practices and the use of dashboard objects like containers and dashboard actions for added interactivity
- Share data insights: Tableau’s story functionality, prepare dashboards for mobile layouts, and share them in different file formats like PDFs and images.
| Provider | DataCamp |
| Instructor | Hadrien Lacroix, Sara Billen, Celia Fryar |
| Level | Beginner |
| Workload | 4 hours |
| Enrollments | 37K |
| Rating | 4.6/5.0 (26) |
| Certificate | Paid |
Best Advanced Visualization Techniques in Tableau Course (Udemy)

Tableau Expert: Top Visualization Techniques in Tableau 10 is an intermediate-level course for experienced Tableau users. Even for Tableau professionals, it can be a challenge to make their visualizations stand out. Thankfully, you can now come out of that dilemma because this course focuses on just that. You’ll not only understand the theory but actually put your knowledge into practice.
In this course, you’ll learn how to:
- Create charts and visualizations that prove your advanced Tableau abilities
- Think creatively to solve complex business problems using Tableau
- Build a Viola Chart
- Construct a Sankey Diagram
- Develop advanced Hexbin Charts
- Visualize Likert Scale survey data
- Implement Hamburger Menu functionality in Tableau.
| Provider | Udemy |
| Instructor | Ben Young |
| Level | Intermediate |
| Workload | 5-6 hours |
| Enrollments | 16K |
| Rating | 4.8/5.0 (1.7K) |
| Certificate | Paid |
Why You Should Trust Us
Class Central, a Tripadvisor for online education, has helped 80 million learners find their next course. We’ve been combing through online education for more than a decade to aggregate a catalog of 250,000 online courses and 250,000 reviews written by our users. And we’re online learners ourselves: combined, the Class Central team has completed over 400 online courses, including online degrees.
Archisha is a Guided Project Instructor and Beta Tester at Coursera. She has taken over 50 online courses. Archisha’s experience as an online learner and teacher has given her some perspective on what to look for in an online course.
Fabio also has experience as a learner and as a tutor who revised the research and the latest version of this article. Pat, who revised the 2024 version of this article, has taken more than 200 online courses.
How We Made Our Picks and Tested Them
Trying to find “the best” can be daunting, even for those of us who live and breathe online courses. Here’s how we approached this task.
First, we combed through Class Central’s Catalog and the internet to find a variety of free and paid courses.
Second, when choosing courses, we considered the following factors:
- Renowned Institutions: we picked the most recognized institutions in Data Analysis Platforms.
- Instructor experience: we looked for instructors with extensive experience in Data Analysis and Tableau.
- Course content: we looked for courses that covered a wide range of topics, from the basics to more advanced techniques.
- Student reviews: we read student reviews (when available) to get a sense of the quality of each course.
To evaluate each course, we watched some of the course videos and read the course syllabus. We also looked at the course’s rating and reviews on Class Central.
Ultimately, we used a combination of data and our own judgment to make these picks. We’re confident these recommendations will provide you with the knowledge to use Tableau confidently.

Archisha Bhar





Tamara
Strange, used Tableau, really liked it mostly. but I believe the company no longer offers support for the product, stating the product was at “end of life”. What is the replacement product. Why buy a certification on an “end of life” product? I am just asking…