7 Best Basic Statistics Courses in 2025 (with Bonus Resources!)
From lost to confident—these courses help you get comfortable with data and emerge as a problem-solver and decision-maker in your workplace.

My most recent revelation: Statistics is a blessing!
I realized this while writing an article. I had to study graphs, charts, and tables to interpret data. I spent hours looking at the numbers, wishing I’d studied harder for stats and treated it with more respect.
Statistics is in demand because data is everywhere and it’s growing. The need to understand data, predict outcomes, and strategize is the need of the hour. In 2023, even Forbes listed statistics as a top skill that employers are looking for.
But numbers can be scary. And if you, too, find charts and tables overwhelming, or you don’t know how to leverage data in decision-making, I’ve brought you the best courses on basic statistics (with bonus resources).
- Why Do You Need Statistics?
- Why Trust Us and Why These Courses?
- The Best Basic Statistics Courses
- Bonus Resources
The Best Basic Statistics Courses


Why Do You Need Statistics?
Daniel Kahneman, a Nobel Prize winner, came up with two systems that help humans make decisions: a quick, intuitive way (or gut feeling), or an analytical, evidence-based way.
According to him, the former helps do routine, automatic tasks (tying shoelaces, cycling, etc), while the latter helps with more effortful tasks like making decisions (which university to choose, which career to pursue, etc). Statistics helps with the latter, and how.
We’re always analyzing data to choose the best way to do something—avoiding a certain route at 8 a.m. due to traffic, buying a stock depending on its past returns, creating a monthly budget, etc.
If it makes your personal life better, imagine how it’ll help your profession!
Statistics involves recognizing patterns in data, visualizing it, understanding it, and then taking action. This is a valuable skill which is why the data analytics market grew from around $39 billion in 2023 to $65 billion in 2025.
Having a statistics base imbibes other skills too:
- Inferential skills
- Critical thinking and problem-solving skills
- Strategic thinking skills
- Analytical skills
Among these, critical thinking and problem-solving are crucial workplace skills that employers are looking for.
If you’d like to learn statistics and are looking for beginner courses, this list is a good place to start.
Why Trust Us and Why These Courses?
There are thousands of online courses out there. Choosing the best one sends you on an online quest to explore platforms and compare them. Even then, before selecting the course, you might think: what if there’s a new course or platform that I don’t know of?
Class Central is a course directory of 250,000 courses, so you find the best course for your needs and spend less time and patience searching for something better. From generative AI to virtual assistance, you’ll find courses that are designed to succeed in your career or even a hobby.
So, how did I choose these courses?
I’ve picked seven courses that cover the basics of statistics. The factors I considered were:
- Level of understanding: Since it has technical aspects, I’ve (mostly) chosen courses that are beginner-friendly
- Diverse learning experiences: Statistics is very important, but learning it could be difficult and boring. In this list, some courses teach with case studies and some with projects and quizzes
- Basic statistical concepts: I’ve picked courses that teach the fundamental concepts (and can be applied to many professions)
- Learner reviews: I have read through reviews and chosen courses that most learners have found helpful and easy to grasp
Note: Many courses have the same syllabus or overlapping topics. Since statistics has numbers and formulae, and these courses are for professionals (or students) who don’t have knowledge about it, I’ve picked ones that have different learning patterns rather than the syllabus. The intent was to help you find a course that supports your learning style.
So here are the best courses on basic statistics.
Become a Probability & Statistics Master (Udemy)
- Level: Beginner
- Rating: 4.7 (13K)
- Duration: 15 hours
- Cost: Paid
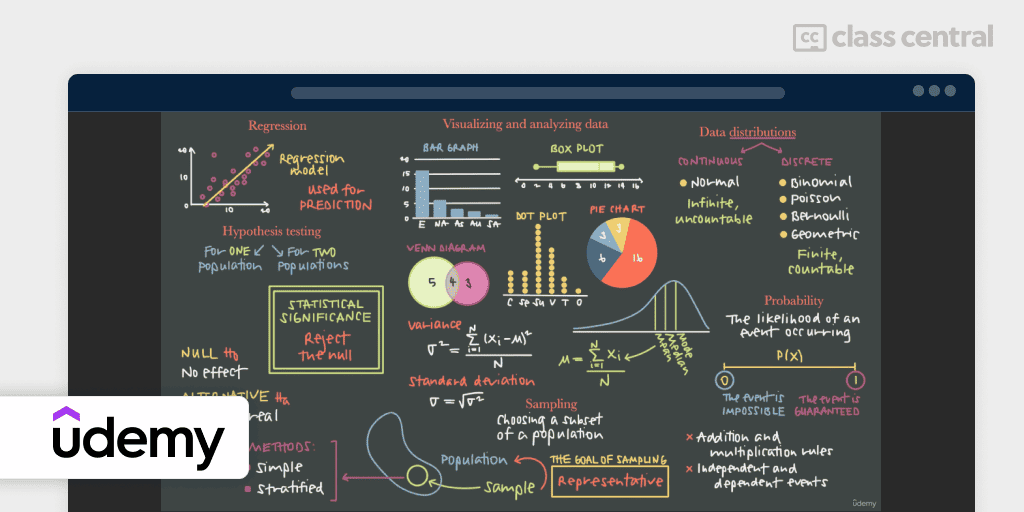
This course has a lot of fans, and it lives up to the hype. It doesn’t just help you read pie charts and graphs (something we all might need brushing up on), but it also advances into topics like regression, which helps in making predictions, spotting relations between variables, and building strategies.
It aims to build strong statistical foundations with hypothesis testing, sampling, probability, and more. With 60+ practice questions and 140 resources, you’ll be able to rationalize charts, graphs and even test your ideas with experiments.
What sets it apart?
- It has 44 quizzes and eight workbooks to practice your skills
- The instructor is Krista King, who has 20 courses on Udemy, and who developed this course because like (almost) everyone, she found math difficult
- It is a comprehensive course which covers the essentials of statistics
- Learners appreciate the instructor’s way of delivery and the course structure
What you might not like
The course has the word “master” in it, the learners have said that it only helps with the basics of statistics.
Who is it for?
- Professionals who don’t have an analytics background but whose jobs involve working with data
- Marketers who want to make sense of data to customize their campaigns
- Professionals who want to revise statistical concepts and check their applications in their career
Introduction to Statistics (DataCamp)
- Level: Beginner
- Rating: 4.7 (966)
- Duration: 4 hours
- Cost: Paid (it’s $14/month, but I got a discount, so you might too!)
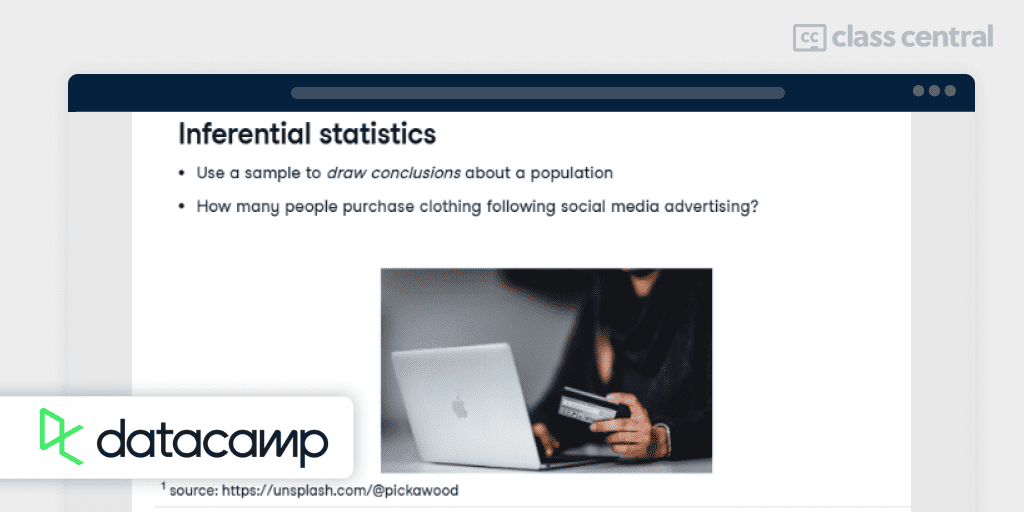
This course is a blend of examples and theory. It’s meant to make you confident and comfortable with data, basically be friends with it.
While It tackles general statistical concepts such as probability, distribution, and correlation, the stand-out factor is that it’s application-oriented. It introduces you to real-world data (including crime, sales, and more) to understand how deductions can be made based on data.
You’ll also learn to predict outcomes, distribute data, and conduct experiments. This course is immersive, and if you’re looking for practice-based learning, go for this one.
What sets it apart?
- The use of real data to learn applications of statistical concepts
- It’s a concise course, so if you have limited time, it’s perfect
- It has regular quizzes and exercises to revise your lessons
- The instructor, George Boorman, is the Curriculum Manager at DataCamp, and an experienced project manager
What you might not like
The course just covers 4-5 fundamental statistical concepts, but important ones
Who is it for?
- Professionals who find it hard to learn statistics
- Anyone who wants to start learning statistics and understand its real-world applications
- Individuals who want a practice-based approach to learning statistics
Statistics Foundations (Coursera)
- Level: Beginner
- Duration: 21 hours
- Rating: 4.7 (310)
- Cost: Free to audit
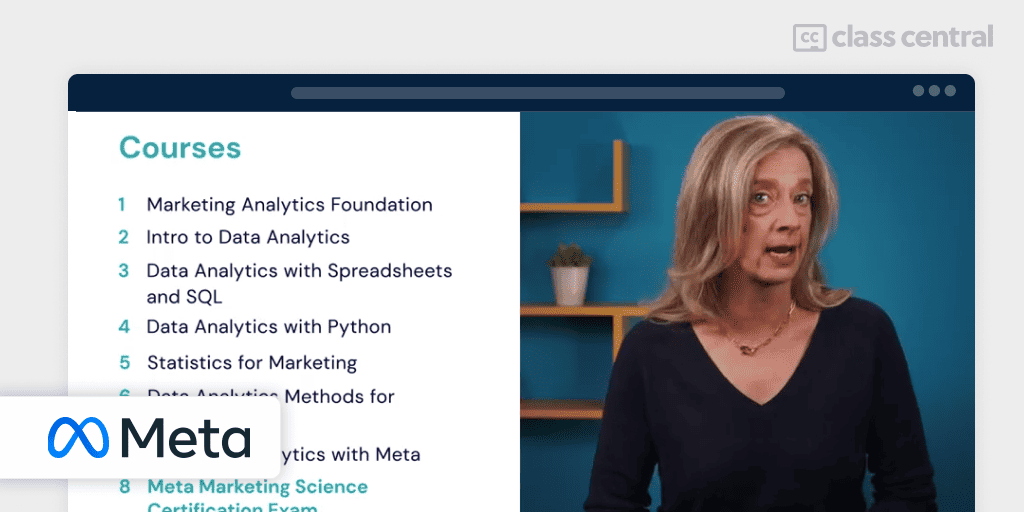
Another beginner’s course, except this one from Meta is specifically designed for marketers.. Most of the topics are similar to other courses, but its comprehensive focus on every concept, made me pick this one.
It has sections on marketing analytics, time series, AB testing, and more. By the end of the course, you will know market segmentation, designing marketing experiments, and analyzing its results.
This course will simplify complex topics as it has sections on micro factors like variables, sample sizes, and more.
What sets it apart?
- It’s by Meta, and it’s robust and detail-oriented
- It will help in applying solutions to marketing problems
- Every module has assignments, quizzes, and review sections
- The instructor, Brandi Robinson, is a Learning and Development expert at Aptly and has 19 years of experience in it
What you might not like
Since there are sections on marketing analytics, it’s more suitable for (aspiring) marketers.
Who is it for?
- Marketing professionals or aspiring managers
- Data analysts and researchers
- Small business owners or e-commerce sellers who want to use Meta for advertising
Data Analytics Foundations (Noble Desktop)
- Level: Beginner
- Duration: 12 hours
- Rating: 4.7
- Cost: Paid

The point of statistics is to analyze data and make relevant decisions. While this is a data analytics course, it teaches you statistical concepts like data visualization and probability.
This course will help you understand how statistical theorems, models, and techniques are used in the real world. Along with theoretical explanations, it also offers you reference materials and activities to learn better.
The best part is you can choose to attend the course in person or take it online. Either way, it guarantees a holistic experience, as one of the learners said, “The course was great, with lots of hands-on activity and useful content..”
What sets it apart?
- The curriculum has been refined over several batches and trainings to offer you comprehensive content
- You can also retake the course for free throughout the year
- The instructor, Mike, is an expert in data analytics and according to learners, he is attentive and patient
- You can choose between in-person (New York) and live online classes
- It teaches in small groups for maximum attention
What you may not like:
The course has a steep fee ($595), but it ensures a comprehensive learning experience with expert instructors
Who is it for?
- Professionals who want to build solid foundations of statistics
- Marketers, researchers, or other professionals who work with lots of data
- Aspiring data analysts who want to learn real-world statistical applications
Statistical Analysis and Research using Excel (Udemy)
- Level: Beginner
- Duration: 12 hours 31 minutes
- Rating: 4.5 (196)
- Cost: Paid
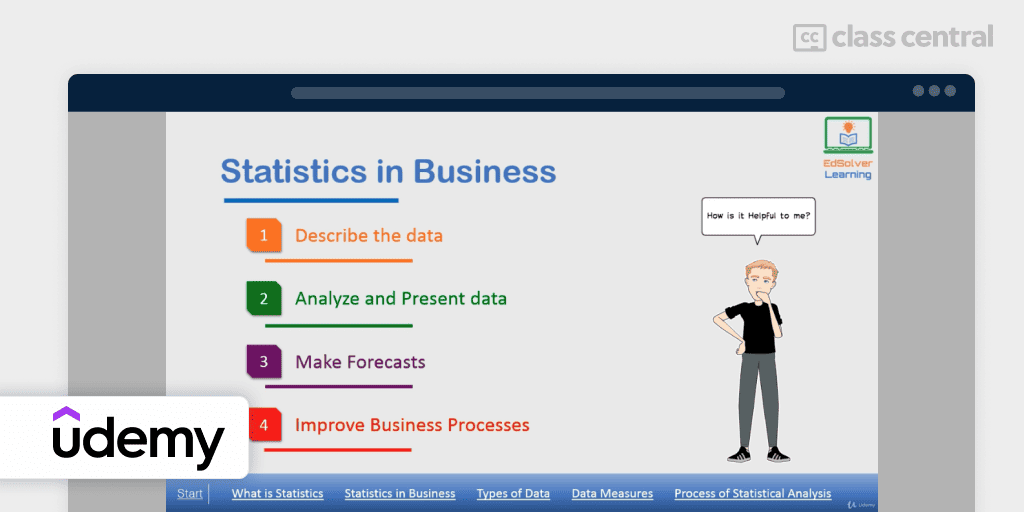
I always wondered why knowing Excel was a flex. Now, I get it. It makes statistics and visualization a breeze! This course teaches you Excel commands to run statistical formulae. While it doesn’t explain every statistical concept, it does help you run calculations.
This course is suited for professionals who conduct research as it covers topics such as ANOVA, T-test, and correlation, among others. If you’re constantly testing products, campaigns, etc, this course will teach you the basics of Excel for seamless and accurate calculations.
With assignments and quizzes, the course also helps you grasp concepts and apply them.
What sets it apart?
- It focuses on Excel to simplify statistical calculations
- The assignments aim to strengthen your hand at Excel
- It will help in research projects that require quick analyses
- It also covers concepts crucial to research —Chi-square analysis, sampling, etc
- The course is by EdSolver Learning, a platform that has taught around 18,000 students courses on data analytics, marketing, management, and more
What you might not like:
It doesn’t teach concepts in detail, it only focuses on Excel applications
Who is it for?
- Marketing professionals who run campaigns
- Researchers and data analysts
- Business owners who want to test their products in the market and have a large sample size
Statistical Thinking for Industrial Problem Solving, presented by JMP (Coursera)
- Level: Beginner
- Duration: 44 hours
- Rating: 4.9 (91)
- Cost: Free to audit
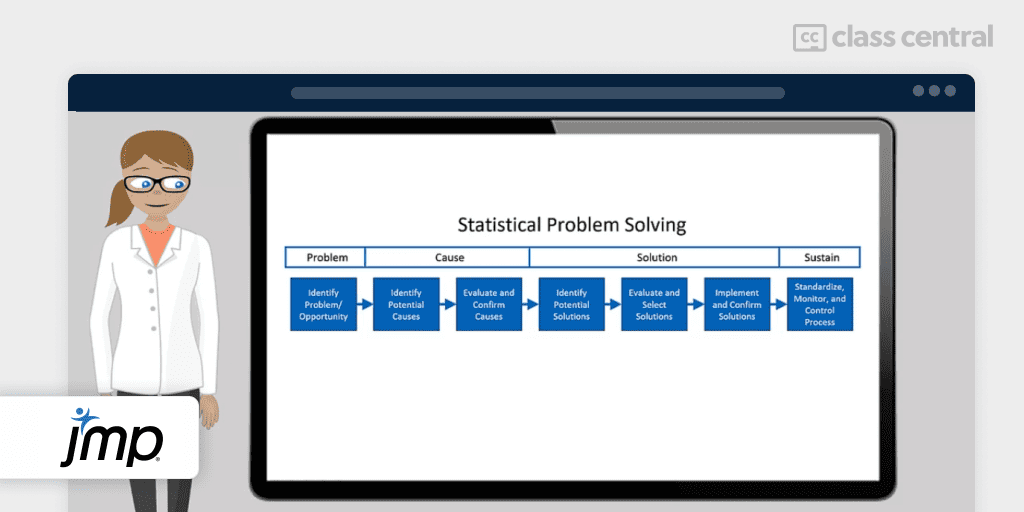
Statistics involves data interpretation, understanding cause and effect, and predicting, creating, or avoiding outcomes.
This seven-module course helps you visualize and make sense of data with statistical techniques. It explains different diagrams, visualization techniques, models for problem-solving, etc.
This course is for decision-makers, especially those who want to make more informed decisions. With modules on data analysis, experimentation designs, and regression models, this course is an in-depth study of statistics and its role in strategy.
What sets it apart?
- It covers the essentials of statistics along with data analysis
- It’s designed to help you solve problems and make calculated decisions
- It’s filled with case studies, quizzes, and practice sections!
- This course is offered by JMP, which has created the JM software for data analysis and statistical discovery
What you may not like
The course is for beginners, but the learning experience will be smoother if you have basic statistics knowledge.
Who is it for?
- Engineers, researchers, doctors, and any professional who has to study large amounts of data
- Aspiring data analysts
- Business owners or entrepreneurs who want to test their products
Statistics Foundations: Understanding Probability and Distributions (Pluralsight)
- Level: Beginner
- Rating: 4 (87)
- Duration: 4 hours 25 minutes
- Cost: Paid membership (with a 10-day free trial)
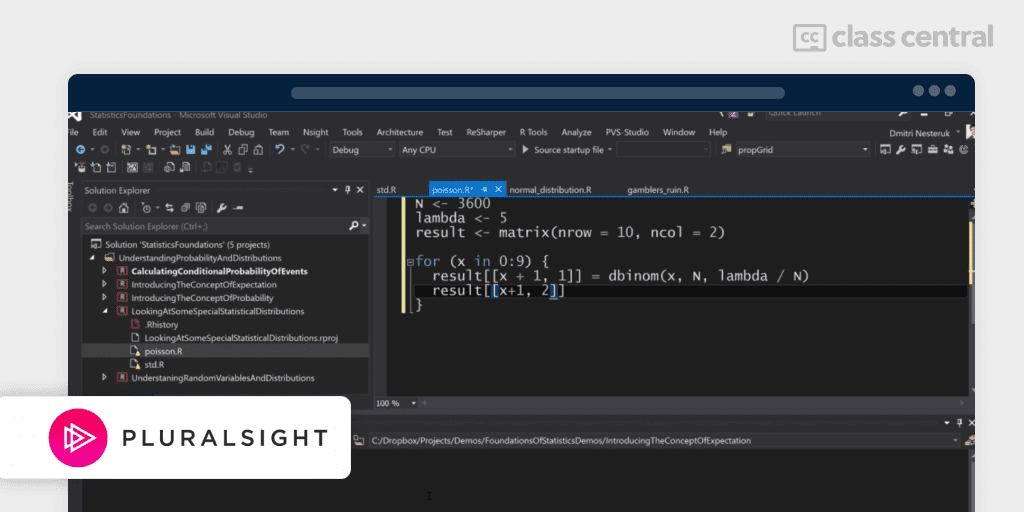
If you’re in the finance, AI, or research field, you’d “probably” have to predict outcomes, control them, and analyze them. This course starts by defining probability and its formulae in detail. It also covers distribution and its components to understand data and make inferences.
This one is perfect for those who know R (a programming language for statistical computing). Along with the basics such as permutations and mean, it explains correlation and covariance too.
Overall, this course focuses on predicting outcomes and analyzing distributions.
What sets it apart?
- It’s a niche course that teaches expectation and analysis
- It teaches statistical analysis through R
- It also explains concepts through demos
- The instructor, Dmitri Nesteruk, is a quantitative analyst with a decade of experience
What you might not like:
- It’s for those who know R software
- It’s more theory-based rather than application-based
Who is it for?
- Professionals who have to predict or control outcomes as a part of their jobs
- Individuals who have a background in statistics and want to improve their R skills
Bonus Resources
This decision-driven analytics course will teach you how to boost sales and marketing with statistics, using Python.
This channel is a gem for those who want to learn statistics concepts quickly. Apart from statistics, it also has videos on data science and AI.
Brandon has a series of TL;DR (Too Long, Didn’t Read) concept videos that offer bite-sized learning. Along with statistics, he also covers math concepts.
Learn with free, downloadable eBooks filled with illustrations, examples, practice exercises, and problems.
The episodes are recorded classes of Brad Fulton, a social scientist who measures the impact of community-based organizations. If you want to be an informed and expert data reader, click that ‘Follow’ icon.
Understanding data is a superpower and it can change your career and life, so give these courses (and numbers) a chance!